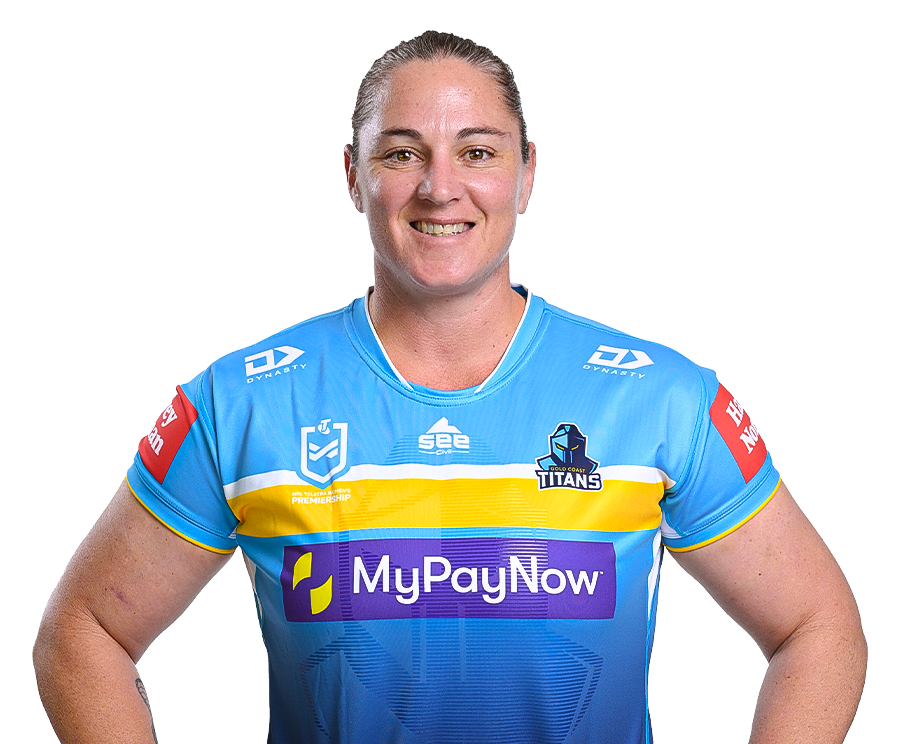
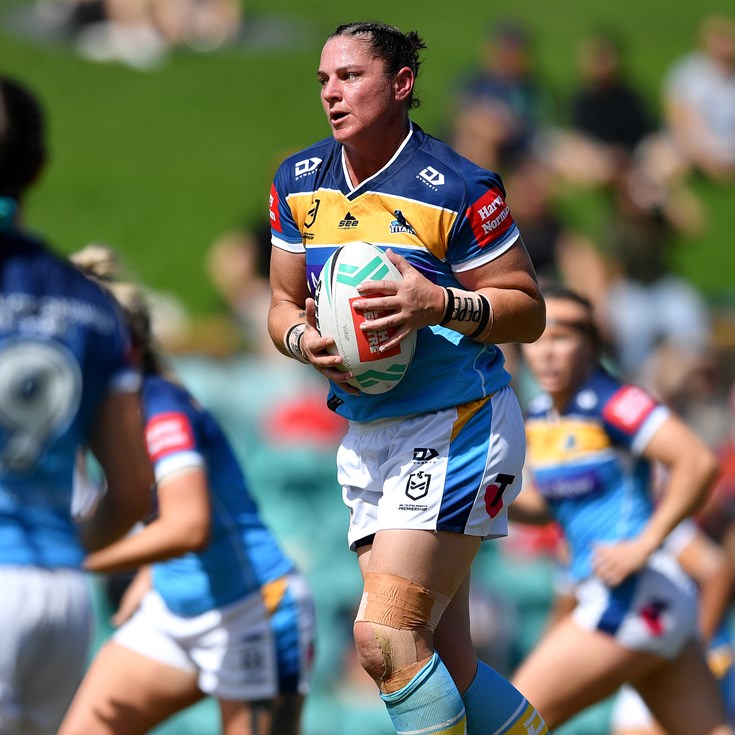

Stephanie Hancock
Prop
Player Bio
- Height:
- 173 cm
- Date of Birth:
- 09 March 1982
- Weight:
- 85 kg
- Birthplace:
- Killarney, QLD
- Age:
- 41
- Nickname:
- Steph
- Debut Club:
- Brisbane Broncos Women
- Date:
- 09 September 2018
- Opposition:
- St. George Illawarra Dragons Women
- Round:
- 1
- Previous Clubs:
- Brisbane Broncos Women, St. George Illawarra Dragons Women
- Junior Club:
- Eastern Suburbs Hornets
- Biography:
An absolute pioneer for women's rugby league, Queensland's favourite daughter joins the Titans after stints with the Brisbane Broncos and St George-Illawarra Dragons. The former Jillaroos captain made her International debut in 2003, winning multiple World Cups in the green and gold as well appearing 16 times for Queensland - her last, winning the 2020 Women's State of Origin before retiring from representative rugby league.
Career
- Appearances
- 33
- Tries
- 8
2023 Season
- Appearances
- 11
Scoring
- Tries
- 0
Attack
- Tackle Breaks
- 19
- Average Hit Ups
- 7.1
- Post Contact Metres
- 388.2
Passing
- Offloads
- 12
Defence
- Tackles Made
- 136
- Tackle Efficiency
-
Running Metres
- Average Running Metres
- 75
- Total Running Metres
- 826
Fantasy
- Total Points
- 262
- Average Points
- 23.8
2023 Season - By Round
Round | Opponent | Score | Position | Minutes Played | Tries | Goals | Points | Kicking Metres | Try Assists | Linebreaks | Tackle Breaks | Post Contact Metres | Offloads | Receipts | Tackles Made | Missed Tackles | Total Running Metres | Hit Up Running Metres | Kick Return Metres | |
---|---|---|---|---|---|---|---|---|---|---|---|---|---|---|---|---|---|---|---|---|
1 | Cowboys | Won | 16 - 6 | Interchange | 28 | - | - | - | - | - | - | 1 | 41 | 1 | 8 | 17 | 2 | 84 | 68 | 12 |
2 | Broncos | Won | 16 - 17 | Interchange | 26 | - | - | - | - | - | - | 4 | 55 | 1 | 10 | 10 | 1 | 111 | 111 | - |
3 | Sharks | Won | 8 - 10 | Interchange | 32 | - | - | - | - | - | - | 4 | 50 | - | 8 | 16 | 1 | 96 | 96 | - |
4 | Knights | Lost | 22 - 10 | Interchange | 27 | - | - | - | - | - | - | 2 | 36 | - | 6 | 10 | 3 | 68 | 39 | 29 |
5 | Roosters | Lost | 8 - 30 | Interchange | 31 | - | - | - | - | - | - | 2 | 39 | 3 | 12 | 10 | 1 | 83 | 83 | - |
6 | Dragons | Won | 22 - 23 | Interchange | 26 | - | - | - | - | - | - | - | 17 | 2 | 7 | 17 | 1 | 41 | 41 | - |
7 | Wests Tigers | Won | 16 - 4 | Interchange | 32 | - | - | - | - | - | - | 1 | 32 | 2 | 9 | 20 | 1 | 84 | 62 | 22 |
8 | Eels | Won | 34 - 12 | Interchange | 23 | - | - | - | - | - | - | 2 | 28 | 1 | 6 | 11 | 1 | 61 | 61 | - |
9 | Raiders | Won | 6 - 30 | Interchange | 26 | - | - | - | 2 | - | - | 2 | 27 | 1 | 9 | 11 | 2 | 64 | 64 | - |
10 | Roosters | Won | 0 - 12 | Interchange | 20 | - | - | - | - | - | - | - | 36 | 1 | 9 | 6 | - | 76 | 76 | - |
11 | Knights | Lost | 24 - 18 | Interchange | 16 | - | - | - | - | - | - | 1 | 28 | - | 4 | 8 | 1 | 52 | 52 | - |
Career By Season
Year | Played | Won | Lost | Drawn | Win % | Tries | Goals | Points | Kicking Metres | Kicking Metres Average | Tackle Breaks | Post Contact Metres | Offloads | Tackles Made | Missed Tackles | Tackle Efficiency | Total Running Metres | Average Running Metres | Kick Return Metres | Total Points | Average Points | |
---|---|---|---|---|---|---|---|---|---|---|---|---|---|---|---|---|---|---|---|---|---|---|
Broncos | 2018 | 4 | 4 | - | - | 100% | - | - | - | - | - | 7 | 95 | 1 | 64 | 5 | 90.68% | 265 | 66.00 | 47 | 98 | 24.5 |
Broncos | 2019 | 4 | 3 | 1 | - | 75% | - | - | - | - | - | 6 | 121 | 7 | 70 | 3 | 92.00% | 305 | 76.00 | 31 | 121 | 30.2 |
Dragons | 2020 | 3 | - | 3 | - | - | - | - | - | 123 | 40.93 | 3 | 84 | 3 | 67 | 9 | 86.97% | 202 | 67.00 | - | 83 | 27.7 |
Titans | 2021 | 6 | 3 | 3 | - | 50% | 4 | - | 16 | 28 | 4.73 | 13 | 167 | 8 | 101 | 9 | 91.82% | 461 | 76.00 | 32 | 228 | 38.0 |
Titans | 2022 | 5 | 1 | 4 | - | 20% | 4 | - | 16 | 25 | 5.00 | 11 | 181 | 7 | 99 | 7 | 93.40% | 443 | 88.00 | 13 | 212 | 42.4 |
Titans | 2023 | 11 | 8 | 3 | - | 73% | - | - | - | 2 | 0.21 | 19 | 388 | 12 | 136 | 14 | 90.67% | 826 | 75.00 | 64 | 262 | 23.8 |
Career Overall
Year Start | Year End | Played | Won | Lost | Drawn | Win % | Tries | Goals | Points | Kicking Metres | Kicking Metres Average | Tackle Breaks | Post Contact Metres | Offloads | Tackles Made | Missed Tackles | Tackle Efficiency | Total Running Metres | Average Running Metres | Kick Return Metres | Total Points | Average Points | |
---|---|---|---|---|---|---|---|---|---|---|---|---|---|---|---|---|---|---|---|---|---|---|---|
Broncos | 2018 | 2019 | 8 | 7 | 1 | - | 88% | - | - | - | - | - | 12 | 200 | 8 | 127 | 7 | 94.78% | 481 | 60.00 | 65 | 201 | 25.1 |
Dragons | 2020 | 2020 | 3 | - | 3 | - | - | - | - | - | 123 | 40.93 | 3 | 82 | 2 | 63 | 9 | 87.50% | 192 | 64.00 | - | 77 | 25.7 |
Titans | 2022 | 2023 | 22 | 12 | 10 | - | 55% | 8 | - | 32 | 56 | 2.53 | 43 | 736 | 27 | 336 | 30 | 91.80% | 1,731 | 78.00 | 110 | 702 | 31.9 |
Latest
Team Mates

Gold Coast Titans proudly acknowledges the Traditional Custodians of the land on which we are situated, the Kombumerri families of the Yugambeh Language Region. We pay our respects to their Elders past, present and emerging, and recognise their continuing connections to the lands, waters and their extended communities throughout South East Queensland.